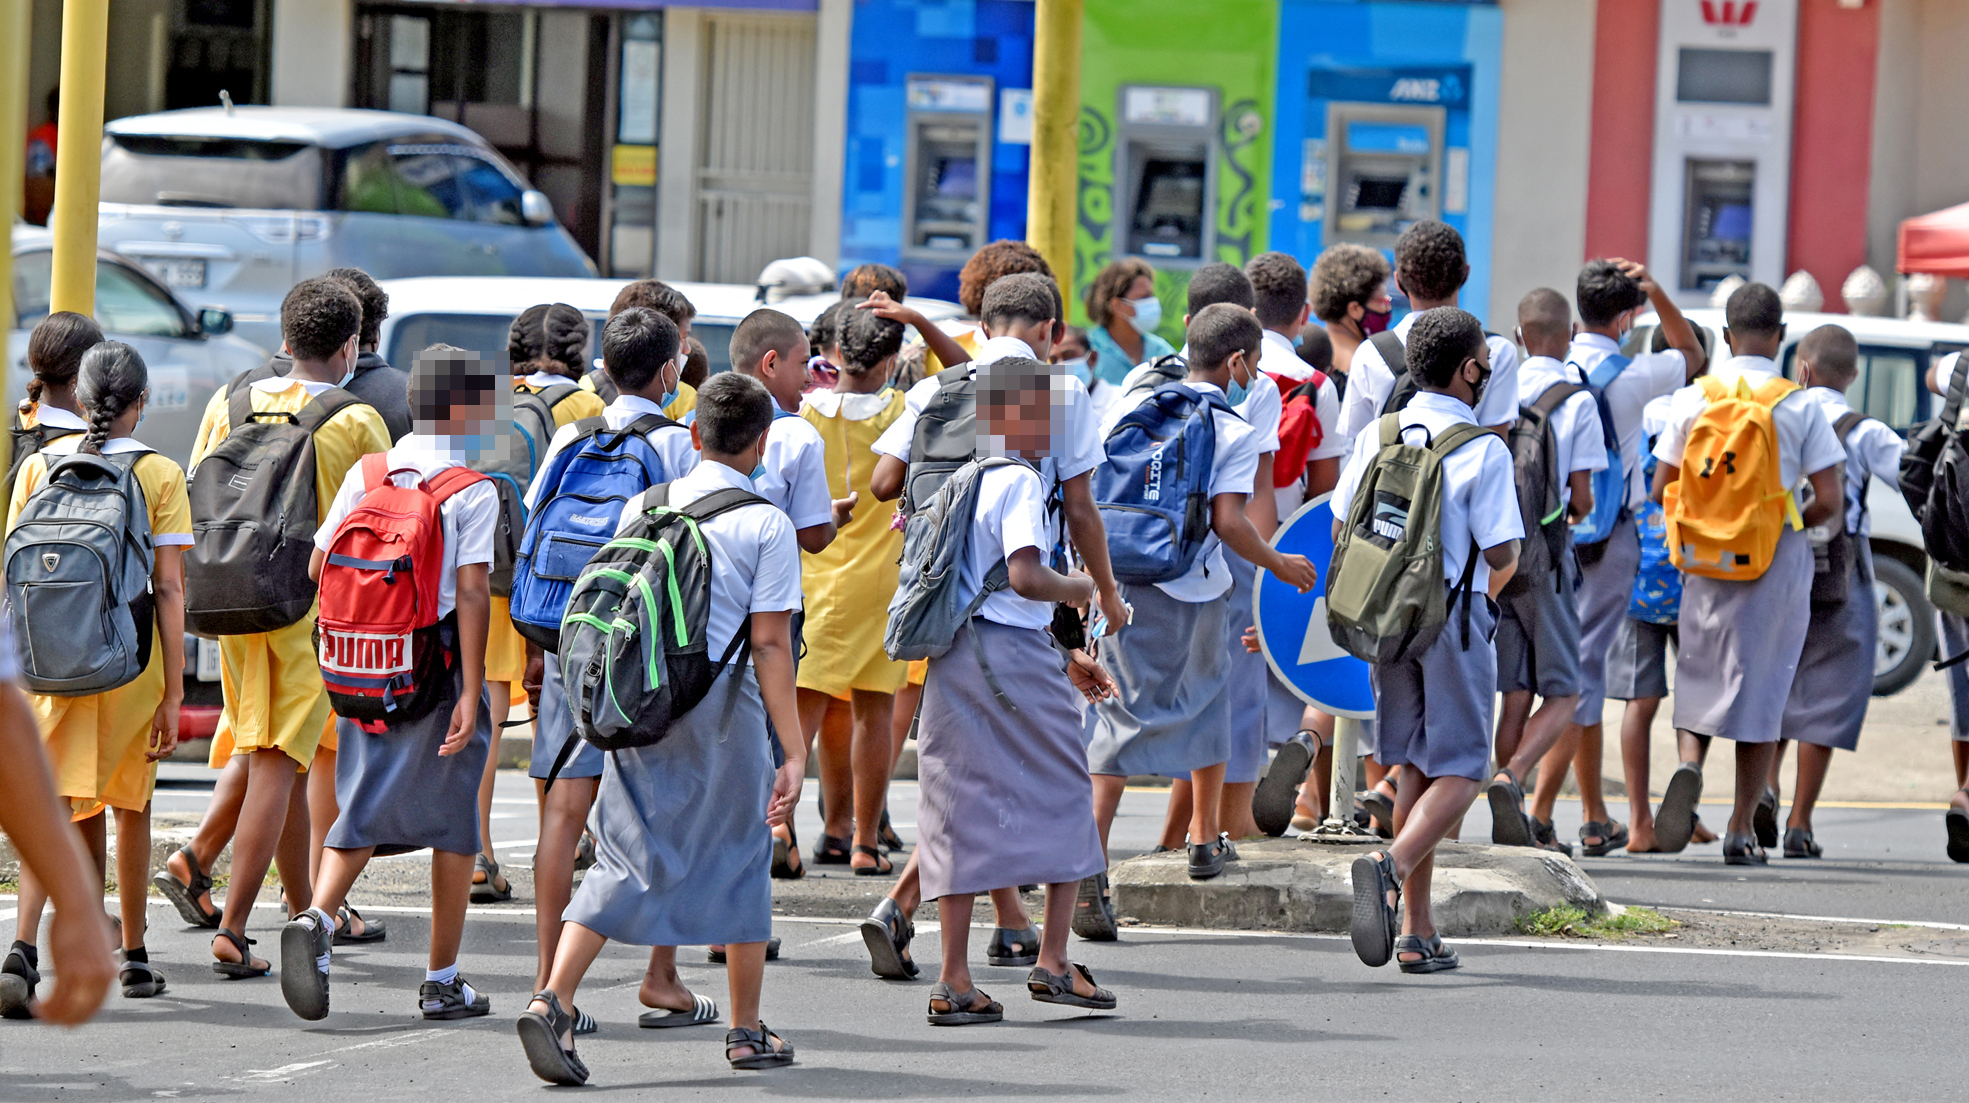
While all Fiji grapples with the massive public debt problem that faces the Coalition Government, totally under the radar is the deep-seated problems facing the most important government service for parents — education of their children.
All parents want their children to have the educational qualifications that can enable them to earn a good living in Fiji or abroad.
A sensible few also worry about the quality of the education that their children are getting and not just the certificates they are receiving.
While compiling my education articles for my forthcoming Volume 4 (For a Decent Fiji) I inevitably have a number on the damaging impact of the Bainimarama government such as undesirable interference with school managements, strange scaling of marks, the elimination of national examinations, and many more.
Of course, these are all education problems that the Coalition Government will have to address today.
But there are many others which I had discovered 15 years ago; the many inequities in funding between urban and rural schools, between provinces, between different school authorities, or different religious denomination.
There were worrying differences in progression and dropout rates, pass and failure rates, teacher quality (qualifications and experience), performances in basic literacy and numeracy, critical school facilities like libraries, internet, dormitories, school canteen facilities, and as always, stark differences between the outcomes for children of the rich and those of the poorest.
But when I tried to see what the state of the education sector might be today, to my deep dismay I found that the Bainimarama government has removed most of the relevant education statistics from the MOE website and from its annual reports.
Why?
Empty MOE website and annual reports
Don’t take my word for it.
Go to the Ministry of Education website and search for “education statistics”.
You will find a glossy website which has removed all the statistics they used to have two decades ago and annual reports which are five years out of date.
There are some aggregate numbers for schools, teachers and enrolments.
But there are no time series on progression rates, or examinations performance in numeracy and literacy, or teacher quality in terms of educational qualifications or experience.
Neither is there disaggregation by rural/urban, by provinces, by ethnicity or gender.
Such statistics used to appear once upon a time more than 20 years ago.
Today, the last annual report on the Ministry of Education website is for 2017 — six years ago.
What an indictment of the last six years of ministers of education and their permanent secretaries.
Even that 2017 annual report does not give coherent time series statistics on all the indicators that matter to parents and school authorities.
You do not need to be an Einstein to figure out that the powerful two in the Bainimarama/Sayed-Khaiyum government simply did not want the public to have free access to education statistics which might enable them to question what that pathetic government was doing to the education of children in Fiji.
The sacking of a previous government statistician (Kemueli Naiqama) for revealing poverty rates by ethnicity was just one example of the vicious extent to which they would go to hide their failures.
But one of their attempts to hide their failure was well publicised by themselves, even if laughable.
Abolition of national examinations
The annual report for 2010 (under minister Filipe Bole and PS Dr Brij Lal) reported this gem for posterity: “The abolition of examination was to reduce or even eradicate school dropouts. It also ensured children completing a 12-year basic education and progress even further into higher education. Instead of external examinations, continuous assessments were designed to assess individual child’s strengths and competence. Teachers will be continually reminded that the practice is consistent with the rest of the world.”
The Bainimarama government decided that the massive problem of school dropouts with large numbers of students not able to pass national examinations, would be solved by getting rid of your national examinations.
In my forthcoming Volume 4 (For a Decent Fiji) are two readings, 15 and 16 which are two censored Letters to the Editor in 2013 and 2014 where I pointed out that national examinations, if well designed, could give solid national indicators of emerging problems, and did not have to be used to stop students from progressing through the school system.
Would any rugby team stop playing international games to hide its deteriorating standards locally?
Perhaps one former prime minister may have been wishing that the national examinations did not exist in his day, so that no one could accuse him today of having been a “school dropout”.
But there are far more disasters taking place in the education system which have been swept under the carpet by the Bainimarama government and its successive ministers and permanent secretaries of education.
I give you just a flavour of these below.
The 2008 FESP Study
In 2008, a consultancy team of Professor Wadan Narsey, Charlotte Blundell and Ian Collingwood was commissioned by AusAID/DFAT to provide a snapshot of the status and quality of Fiji’s education sector to assist the Australian Government’s aid program to Fiji.
It resulted in the Fiji Education Sector Project.
My main contribution was in the statistical analysis of available MOE data at all levels of education in Fiji; school endowments, financing, teacher characteristics, enrolment trends, student assessment and performance, and many related variables not discussed today.
I acknowledge that my access to the raw data was approved by then interim minister of education, (the late Filipe Bole), and the permanent secretary, (Emi Rabukawaqa).
The complex raw data transfer was facilitated by Manisha Prakash (from SIMS schools database), and Ravi (from the Examinations Section).
I also managed to analyse the FBS Household Income and Expenditure Survey data for 2002-03 for education-related statistics, all enabling snapshots of differentials of access to education and private household funding of education by income classes and ethnicity.
Even in 2008, there already were many worrying trends, which have probably got worse today.
What standards for national assessment?
Even in 2006, the assessment systems were in flux and some would say incoherent and inconsistent.
Different groups of students were sitting different national examinations such as FILNA tests in numeracy and literacy at Class 4 and Class 6 (not all students doing so); different groups sitting Fiji Intermediate Examinations at Class 6 (in four compulsory areas (English composition, English comprehension and grammar, mathematics and general subjects) as well as three optional areas; Fijian, Hindi and Urdu.
Unfortunately, schools, teachers and students had to choose between the two sets, inevitably leading to a sacrifice of one for teachers to “prove” competence and performance in the tests selected.
These tests should surely have been complementary not competing: literacy and numeracy are important, but so also are the other subject areas.
Already in 2007 there was an emerging story of confusion in the standards of measurements of academic performance of students, use of “raw marks” and “scaled marks” and the “pass rates” resulting from some arbitrarily chosen “pass mark” (see below).
The 2007 Report on the Fiji Intermediate Examination had these statements which assessment experts would cringe over: “The scaled subject means are consistent with those of last year’s. This is an indication that the examination has maintained its standard. Variations in subject performances were observed.”
Then “There was a significant decline in the raw means of four subjects: Mathematics, Fijian, Hindi and Urdu. The level of performance in the remaining subjects improved when compared to 2006. This is because the raw means in the two English exams and General Subjects increased”.
Statistics presented in this 2007 report shows that the national mean for FIE English comprehension declined massively from 60.2 in 2005 to 50.7 in 2006.
How on earth could there be such large changes in academic performance at the national level?
Was the “degree of difficulty” of the different examinations being allowed for?
Then for these same years, the “scaled” means went from 71.5 to 73.0 to 70.4.
There was no explanation for the basis for scaling the marks and by such large percentages (a hint to this in the graphs below).
What on earth was actually happening to academic standards on the ground? (see further below).
Some provinces were lagging badly
When I analysed the examinations raw marks there were clear and significant regional differences and trends which were extremely worrying, given that we all accept that children of rural areas should not be disadvantaged relative to urban areas.
The results for Suva schools were +7 per cent, +9 per cent and +6 per cent higher than the national averages for these three years.
The results for Ra schools were -17 per cent, -14 per cent and -18 per cent lower than the national averages.
The averages for Macuata/Bua schools were -3 per cent, -4 per cent and -5 per cent lower than the national averages.
The averages for particular schools were of course horrifyingly worse (or happily much better) given that even these provincial differences were themselves averages of schools within these provinces.
Is it any wonder that parents worried about their children’s education, make every effort to move to urban areas and good schools.
The marks for performance in mathematics showed the same patterns as for performances in English suggesting that there were indeed serious problems in all the subject areas.
Ethnic differentials were worrying
Another worrying area was indicated by disaggregation of academic performance by ethnicity.
The FIE Mathematics means for 2005 2006 and 2007 showed that indigenous Fijian students averages were -7 per cent, -4 per cent and -7 per cent (systematically worse) from the national average for these years.
In contrast, the Indo-Fijian averages were 10 per cent, 10 per cent and 14 per cent better than the national average, appearing to be better and perhaps improving.
Such ethnic differences were evident at all levels of schooling and for individual schools.
The national implications of such wide ethnic disparities in pass rates may be seen in the attached graph of pass rates (arbitrarily set by me at the scaled “Final Score” of 50) in Fiji School Leaving Certificate maths Examinations results for 2003 to 2007.
In 2006 for instance, 71.4 per cent of Indo-Fijian students were passing, compared to only 48.4 per cent of indigenous Fijian students.
Given such huge ethnic disparities in educational performance at this level, you can imagine the national political implications for scholarships, for training and eventually job placements, if inordinately large proportions of indigenous Fijian students were not qualifying academically.
What was scaling doing?
My personal detective work with all this assessment data indicates that quite different scaling factors were applied in different years.
For instance, in 2003 the scaled mark for those passing was given by the equation = 34 + (0.63 * the standard score); whereas in 2007 the scaled mark was given by the equation = 42+ (0.56 * the standard score).
These equations both had correlation coefficients of 0.99 so were quite reliable.
To give an example the ordinary readers can understand, in 2003, the student’s standard score was multiplied by a factor of 2.0 to get the scaled mark of 50.
In 2007, the standard score was multiplied by a higher factor of 2.8 to get a scaled pass mark of 50.
Why were the factors so different?
Here is a fascinating question that someone somewhere “in the know” can answer:

In Graph 1 above, did the average pass rate for Indo-Fijian students rising from 65.4 per cent in 2003 to 71.4 per cent in 2006 indicate their academic performance was really improving that much (which I personally doubt)?
Or were the MOE authorities simply applying a higher scaling to maintain “satisfactory” pass rates of Fijian schools, some of which were showing horrendously declining standards, even some elite Fijian schools (and in the process artificially bumped up Indian pass rates)?
Ethnicity not the problem
I would like to point out that the most important factor in the ethnic differences in academic performance was not ethnicity, but probably other factors to do with the schools (such as quality of teachers, management, school motivation etc.).

Graph 2 gives the pass rates of indigenous Fijian students in aggregate (bottom line) and in six of the best schools in Fiji with mixed ethnicity: two in the West, three in Suva and 1 in the North. You can probably guess which schools these are.
Note the really good news that the indigenous Fijian students attending these excellent multiracial schools (majority Indo-Fijian or Chinese) had average pass rates of above 80 per cent and even 100 per cent in some years.
Clearly, ethnic disparities in academic performance throughout Fiji needed to be explained by factors other than ethnicity.
But as with the measurement of poverty in Fiji, the Bainimarama/Sayed-Khaiyum Government “solved” the problem of indigenous Fijians lagging behind in education, by banning the release of any education statistics disaggregated by ethnicity (and sacking the government statistician Naiqama). How smart was that solution, probably originating from the powerful “smart kaidia”?
Massive disparities in teacher Qualifications
The MOE also had a comprehensive SIMS database on all secondary school teachers, their qualifications and their years of experience.
While the MOE itself had not analysed this database (no reports were produced), I attempted to do so for that 2008 FESP exercise and obtained statistics on major differences throughout Fiji.
Thus rural schools had a lower 27 per cent of teachers with at least degree qualifications, while urban schools had 35 per cent.
Rural teachers had a lower average of 9.0 years of experience compared to 10.8 for urban teachers.
A much higher percentage (46 per cent) of Indo-Fijian secondary school teachers had degrees or better compared to a much lower 8% for indigenous Fijian teachers (no doubt feeding into their schools’ academic output).
On the other hand, indigenous Fijian teachers had a much higher average years of experience (12.5 years) compared to the much lower 7.8 per cent for Indo-Fijian teachers (no doubt dues to their higher rates of emigration).
All the differences mentioned above in secondary were also present throughout the primary school system.
There can be no doubt that the academic performances of students must be affected by all these differences in the qualifications of teachers and their years of experience.
An insurmountable challenge for the MOE (then and now) was how to ensure that good quality teachers could be posted to even out the differences, especially given that most teachers preferred to teach in urban schools.
Massive differences in financing
While the MOE had huge amounts of data on the Government financing of schools there was little analysis of urban/rural and provincial disparities at all levels: preschool, primary and secondary.
There was little analysis of what schools themselves raised through their own efforts, all brought to a halt by the Bainimarama government’s misguided policy to stop school fund raising.
There was little analysis of private expenditure on education in which there were clear disparities between education authorities. There was little analysis of what donors poured into the education sector at all levels.
There was also an urgent need to examine per pupil expenditures at pre-school, primary, secondary and tertiary levels and some assessment of the appropriateness.
My FESP analysis of the MOE data showed that there was incredible variation throughout Fiji in recurrent revenues, recurrent expenditures, capital expenditures per pupil: rural/urban, provinces, and school authorities.
All these variations must on a priori grounds be assumed to have some impact on educational performance in marks, pass rates, progression rates and academic standards by national examination results.
My analysis of the 2002-03 HIES showed that the Top 20 per cent of the income brackets spent far more on education at all levels than the lower income brackets.
The data also showed that considerable higher proportions of children from the poorer households had dropped out of schools at all levels, than from high income brackets.
There were other problems such as higher levels of education with much smaller numbers of students receiving considerably higher per student funding, which coming out of a total education budget, effectively deprived the lower levels of education affecting much larger numbers of students.
Library, internet, computerisation and canteen facilities
The available MOE data indicated clearly that there were massive differences in school endowments even in 2008.
There were massive differences in library facilities, school computers and Internet access.
There were also serious differences in the quality of dormitories and food provided through school canteens, all having some bearing on school learning experiences.
It would be fascinating to see what the situation is today.
Does lack of statistics mean deterioration?
While this article has focused on the disappearance of education statistics for the public, does this mean that it has been accompanied by an erosion of the education system?
Not necessarily.
It is possible, theoretically, that despite denying the public free access to education statistics, the education system has been miraculously improving between 2006 and 2022.
Perhaps the Bainimarama/Sayed-Khaiyum government just did not want the public to know about the huge improvements they were bringing for all “Fijians” who were all “equal” under their rule.
Ha ha ha ha ha. Laugh for as long as you want.
Some good news
In my recent study for the FWRM (beyond 33 per cent) I presented some statistics to show that at early childhood levels, there had been significant improvements in school attendance because of the Bainimarama government’s subsidy of preschools.
There was also data to show the enormous increase in output of graduates of both males and females, because of the impact of University of Fiji and Fiji National University.
In particular, there was almost gender parity of graduate by the year 2016.
I suspect that there may have been further improvements in that regard although there is little understanding of the impact on quality of graduates.
Also clear from much of the disaggregated data I had analysed in 2008 was that girls were outperforming the boys in examinations at all levels and in most subjects, a reversal of the usual concern for females lagging.
While all-girls schools like ACS are still shining academic stars, there are a number of elite Fijian boys only schools in deep trouble with falling academic standards, not helped by 16 years of under-educated macho military leadership at the highest levels.
No lack of education advisers
It seems clear that there is an absolutely urgent need for the MOE to do a thorough expert quantitative and qualitative review of what has happened to Fiji’s education system over the past two decades, with all the findings made available to the public for discussion and debate.
There may be retired experienced MOE technical staff still around.
There are experienced past principals like the highly respected Amraiya Naidu who once brought about immense academic improvements at a (still) struggling elite Fijian boys’ school, but was transferred for no good reason (but you can guess why).
There are also experienced former teachers who often write to The Fiji Times, like Brother Fergus Garrett.
A certain Tahir Ali (who I see is still writing today) once wrote a Letter to the Editor (Sunday Times, October 26, 2008) pointing out the contradictions and inconsistencies in the MOE’s assessment systems.
Frequent The Fiji Times writer and retired teacher, Arvind Mani, even went to the trouble of trying to advise ministers of education Rosy Akbar, Premila Kumar and Dr Mahendra Reddy, but his words of wisdom fell on deaf ears, more attuned to the “smart kaidia” supported by the former PM.
Note that Fiji is not alone in facing declining standards in education.
In the spotlight in Australian news today (13/4/2023) is the concern that Australian school children are falling behind in numeracy and literacy and that there has been no national study on this problem done for several years.
How shocking for a rich country like Australia.
It will be interesting to see what the Rabuka Government and Education Minister Aseri Radrodro come up with over the next four years to fix up Fiji’s education system which has been so badly eroded over the past 16 years.
I hope more than just a new Board of Governors for government schools.
- Prof Wadan Narsey is one of the region’s senior economists and a regular commentator on political and economic issues in Fiji. The views expressed in this article are not necessarily the views of The Fiji Times.